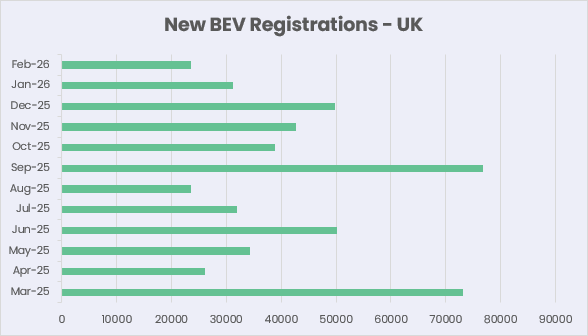
There were 23,587 new BEVs registered in the UK in February 2026, which is just over 5% more than the same month last year. However, SMMT reports that BEV market share in February 2026 was 24.2%, down by around 1% from February 2025. For the second month in a row, this falls well short of the ambitious 33% ZEV mandate target for 2026.
We would not read too much into this until we have seen March data, where new registrations tend to spike with the introduction of the new age identifier plate and the looming new tax year. Last year, March-2025 was a record month in terms of new registrations at the time, with us recording 73,209 new BEVs on the road in the UK.
Vehicles on the Road Data
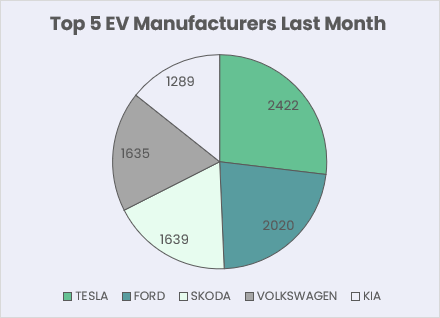
Tesla move back to the top of the leader board for the month of February with 2,422 new registrations recorded after barely featuring in January. Ford, Skoda, Volkswagen and Kia make up the rest of the top 5 with Renault dropping from 5th to 7th and Audi climbing up to 6th place. Chinese manufacturers didn’t leave much of a footprint either, with BYD being the best of a sparse bunch with 1,009 new registrations. No doubt, as per above, stock will have been held back for the March new age identifier plate, and we will see a different story in four weeks’ time.
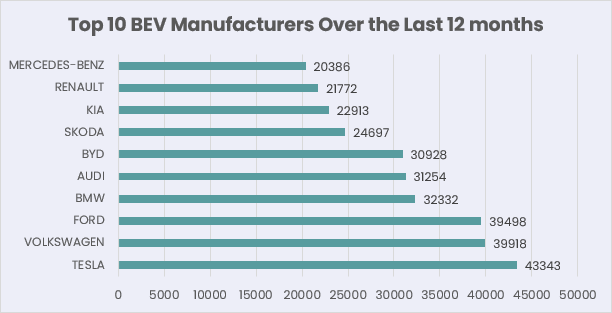
For the first time in a long time, there has been no change to the top 10 BEV manufacturers over the last 12 months. Hardly surprising, given the modest number of new registrations in February. One notable area of change is Ford being neck and neck with Volkswagen in 3rd and 2nd respectively. This time last year, Ford did not feature in the top 10 manufacturers at all and less surprisingly BYD were also nowhere to be seen when looking back 12 months from Feb 2025.
Crash Repair Costs Data
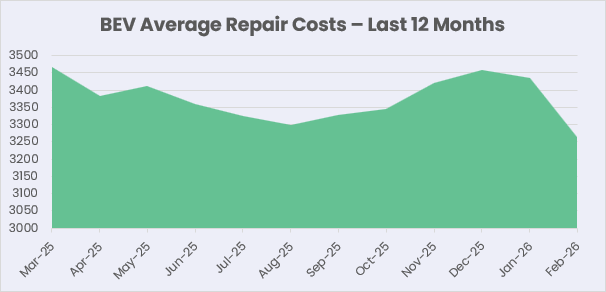
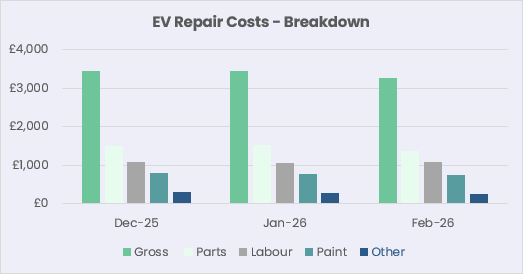
BEV average repair costs came down across the board in February. There are caveats, in that it’s a particularly short month and we are due to realise some of the lengthier more expensive repairs that will surely edge up the costs for February in due course.
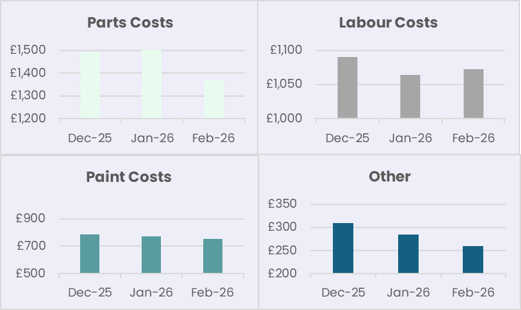
A further underlying reason for repair costs coming down is that average Parts Costs have come down by more 10% month-on-month. Looking back at our historic data, this is a trend we have seen every year in February for the last 5 years. We understand this is due to initial seasonal repairer backlogs clearing, making parts easier to source and lower in cost. Labour and Paint costs have stayed relatively flat moving from January to February.
Repair costs for all five tracked manufacturers moved down in February. Audi saw the most extreme change, reducing by over 11%, and with Tesla we saw more volatility than we have seen from them in 12 months, with average repair costs reducing by 6.9%.
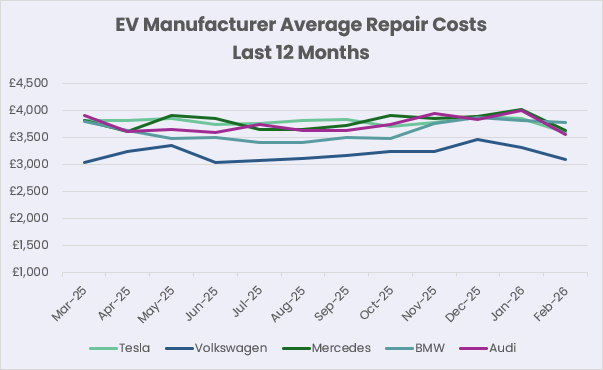
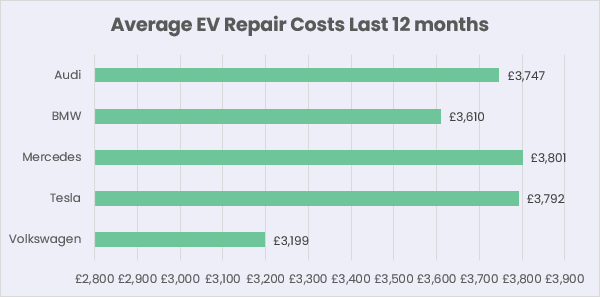
BMW changed the least, reducing by only 1.2%. However, BMW repair costs have been significantly lower than Tesla, BMW, and Audi over the last 12 months. Mercedes finds themselves at the top of the pile over the last year.
Volkswagen repair costs remain much cheaper than the other four, averaging out at around £3,200 for the last year. It’s worth noting that that Volvo, Nissan, and Kia are all on average close to £200 less to repair than Volkswagen.
Average Accident Repair Costs by Manufacturer – Last 3 Months
| Dec-25 | Change | Jan-26 | Change | Feb-26 | Change | |
| Tesla | £3,891 | +2.9 | £3,860 | -0.8 | £3,595 | -6.9 |
| Volkswagen | £3,471 | +7.1 | £3,313 | -4.6 | £3,097 | -6.5 |
| Mercedes | £3,896 | +1.0 | £4,017 | +3.1 | £3,627 | -9.7 |
| BMW | £3,867 | 2.9 | £3,822 | -1.2 | £3,778 | -1.2 |
| Audi | £3,829 | -3.1 | £4,001 | +4.5 | £3,556 | -11.1 |
n.b. Repair Costs are inclusive of discounts, but excluding tax
Other News
We noted with interest Generational’s 2025 Battery Industry Benchmark Report that was released last month. Generational are a UK based battery testing solutions provider. Their report looked at results from more than 8,000 EV battery tests all conducted in 2025, delivering very encouraging data.
From all tests, average battery health stood at slightly above 95%. For cars that had been driven for more than 100,000 miles the results tended to fall between 88% and 95% and for older vehicles of between 8 and 9 years of age held a median average of 85% battery capacity.
With petrol prices soaring and 2nd hand BEV values under increasing pressure, this report can be viewed as a major positive for drivers looking to switch to a used BEV.